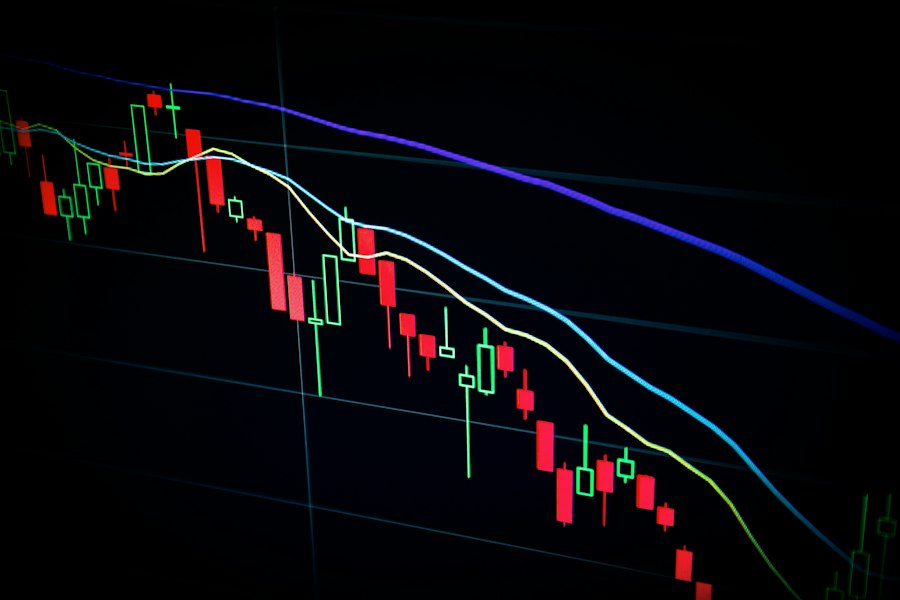
The most dangerous rallies are often the cleanest on the index chart. A cap-weighted benchmark can print fresh highs while the average constituent is rolling over, because passive flows, dealer hedging and mega-cap momentum compress risk into a handful of crowded winners. That is why market breadth is not a secondary indicator; it is the internal health check that tells us whether a rally has institutional sponsorship or merely index-level optical strength.
In the current risk tape, crypto is flashing a similar message. Bitcoin trades near $63,793, up 2.27% over 24 hours, while Ether is outperforming at $1,861.97, up 5.33%. BNB, Solana and Cardano are also green, but the dispersion matters more than the color. When ETH leads BTC and large caps rise together, breadth is improving. When only BTC rallies while majors, DeFi tokens and high-beta altcoins lag, the move is usually liquidity-driven rather than broad risk acceptance.
What is market breadth?
Market breadth measures how many securities are participating in a move, not just whether the headline index is rising. A broad rally has many stocks, sectors or tokens advancing together; a narrow rally is dominated by a small group of large weights.
The classic equity breadth toolkit includes advance-decline lines, the percentage of stocks above the 50-day and 200-day moving averages, new highs versus new lows, equal-weighted performance versus cap-weighted performance, and sector participation. In crypto, the same concept translates into BTC dominance, ETH/BTC relative strength, the percentage of top 100 tokens above key moving averages, stablecoin liquidity, decentralized exchange volumes, and whether perpetual funding is concentrated in one or two crowded names.
The reason breadth matters is mechanical. Cap-weighted indices can mask fragility because the biggest constituents carry disproportionate influence. In the S&P 500, the top 10 companies have recently represented roughly one-third of index market capitalization, near the highest concentration levels of the modern ETF era. If those names have positive earnings momentum and heavy passive inflows, the index can rise even if hundreds of smaller constituents are flat or negative.
That is not automatically bearish. Narrow leadership can persist for months when profit revisions and liquidity support the leaders. The problem is risk asymmetry: as leadership narrows, the market becomes more sensitive to single-stock earnings gaps, regulatory shocks, rate volatility and dealer positioning around large options expiries.
How does market breadth work across equities and crypto?
Breadth works by comparing index-level price action with underlying participation. If the index is making higher highs while fewer components confirm, the rally is losing internal momentum even if price remains bullish.
In equities, one of the cleanest tests is the cap-weighted S&P 500 versus the equal-weighted S&P 500. When the cap-weighted index outperforms equal weight, leadership is concentrated in large caps. When equal weight catches up, the rally is broadening into financials, industrials, healthcare, small caps and cyclicals. A healthy bull market does not require every sector to lead, but it does require enough participation to absorb profit-taking in the dominant names.
Another useful threshold is the percentage of S&P 500 constituents above their 200-day moving average. Above 70% usually signals durable participation. Between 50% and 70% is constructive but selective. Below 50% while the index is near highs is a warning that capitalization weighting is doing too much work. For shorter time horizons, the 20-day and 50-day readings help identify whether pullbacks are being bought broadly or only in mega-cap leaders.
Crypto breadth is structurally different because the market is more liquidity-sensitive and less earnings-driven. Bitcoin often acts as the reserve asset, ETH as the high-quality beta asset, and altcoins as a liquidity amplifier. A broad crypto rally typically shows BTC rising first, ETH/BTC stabilizing or rising, layer-1s and DeFi following, then smaller capitalization tokens participating. A narrow rally shows BTC dominance rising while altcoin market breadth deteriorates, often because traders want crypto exposure but not balance-sheet or protocol risk.
The current snapshot is moderately constructive because ETH is outperforming BTC on a 24-hour basis, 5.33% versus 2.27%. That spread suggests risk appetite is not confined to Bitcoin. But one session is not confirmation. I would want to see ETH/BTC hold gains, top-50 token participation expand, and funding rates avoid overheating before calling it a broad crypto advance.
Why does narrow leadership matter for traders?
Narrow leadership matters because it increases gap risk, correlation risk and volatility convexity. When too much index performance depends on a small basket of winners, any reversal in those names can force systematic selling across the entire market.
The volatility market usually sniffs this out before the index does. In narrow rallies, realized volatility can remain suppressed because the index drifts upward, but single-name volatility stays bid around the leaders. That creates a regime where index volatility appears cheap while concentration risk is rising under the surface. Traders looking only at VIX may miss the stress building in dispersion, skew and correlation.
Options positioning can make the structure more fragile. If investors buy upside calls in the same mega-cap leaders, dealers who are short those calls hedge by buying stock as prices rise, creating a gamma-assisted melt-up. That is supportive until it is not. Once spot falls below large call strikes or implied volatility reprices, dealer hedging can flip from supportive to destabilizing, especially around monthly expiration or after earnings.
This is why breadth and volatility should be read together. A rally with improving breadth and falling implied volatility is usually healthy because risk is being distributed. A rally with deteriorating breadth, rising single-name call volumes and declining index volatility is more suspect. It often means investors are paying for upside in the leaders while ignoring portfolio-level downside.
The same applies to crypto perpetuals. If BTC or ETH rallies while funding remains moderate and open interest rises gradually, the move is more sustainable. If price rises with aggressive funding, crowded long positioning and no participation beyond the top two assets, the rally is vulnerable to liquidation cascades. Crypto breadth is not just about spot performance; it is about leverage distribution.
What happens if breadth confirms the rally?
If breadth confirms the rally, pullbacks are more likely to be shallow and rotational rather than trend-ending. Broad participation creates multiple sources of demand, reducing dependence on a single sector, stock or token.
In equities, breadth confirmation usually shows up in three places. First, equal weight begins outperforming cap weight over a multi-week window. Second, the percentage of stocks above the 50-day moving average expands after a pullback rather than fading. Third, credit spreads remain contained, because equity breadth and credit risk appetite tend to move together when the macro backdrop is stable.
For portfolio construction, that changes the playbook. In a narrow rally, I prefer barbell exposure: own quality leaders, hedge with index puts or put spreads, and avoid chasing weak cyclicals. In a broadening rally, I want more beta through equal-weight indices, mid-caps, financials, industrials and selective crypto beta. The hedge ratio can come down because the market is less dependent on a few crowded trades.
For options traders, broadening participation favors selling rich single-name volatility against owning cheaper index convexity only if correlations are low and earnings risk is manageable. But if breadth improves while correlations rise, index options become more valuable because a macro shock can move everything together. The key is to separate dispersion opportunity from systemic risk.
Crypto traders should watch whether ETH strength is confirmed by liquidity in Solana, BNB, DeFi governance tokens and decentralized exchange volumes. Solana at $76.78, up 1.32%, is positive but lagging ETH in the snapshot. If SOL and other high-beta majors fail to accelerate while ETH leads, that is still selective participation. If they begin outperforming alongside expanding spot volumes, the probability of a broader altcoin impulse improves.
How should traders measure breadth without overfitting noise?
Traders should use a small dashboard of breadth indicators across time horizons rather than chasing one signal. The best breadth analysis combines participation, relative performance, volatility pricing and liquidity conditions.
My preferred equity dashboard has five components. None is perfect alone, but together they reduce false positives:
- Percentage above the 50-day moving average: confirms whether intermediate momentum is expanding or contracting.
- Percentage above the 200-day moving average: separates cyclical bull markets from short-covering rallies.
- Equal-weight versus cap-weight ratio: identifies whether the median stock is keeping pace with the index.
- New highs minus new lows: detects whether leadership is expanding or defensive rotation is masking weakness.
- Sector participation: checks whether gains are concentrated in technology and communication services or spreading into banks, industrials, energy and healthcare.
For crypto, I would replace sector participation with token cohort participation. Track BTC dominance, ETH/BTC, top-20 versus top-100 performance, stablecoin supply growth, exchange volumes and perpetual funding. A credible crypto breadth thrust requires spot-led buying, not just leverage-led open interest. If stablecoin liquidity is flat and funding is elevated, breadth signals deserve a discount.
Time horizon matters. A one-day breadth thrust can be short covering. A five-to-ten session improvement after a correction is more meaningful. In equities, breadth thrust studies historically show that when a large share of stocks flips from oversold to advancing over a short window, forward returns improve because systematic strategies and discretionary managers are forced to re-risk. But the signal is strongest when confirmed by credit spreads and earnings revisions.
Risk management should be explicit. If breadth deteriorates while the index rises, reduce gross exposure or rotate from high-beta laggards into liquid leaders plus hedges. If breadth improves after a volatility spike, add exposure in tranches rather than all at once. If breadth and price diverge for more than several weeks, assume the index is vulnerable to a fast 3% to 7% air pocket even if the long-term trend remains intact.
My rule: price tells you who is winning today; breadth tells you how many buyers are still available tomorrow.
Bottom Line
Broad rallies are durable because leadership rotates, liquidity disperses and pullbacks attract buyers across multiple sectors or token cohorts. Narrow rallies can still make money, but they carry higher gap risk, higher crowding risk and a greater probability that volatility reprices suddenly.
Right now, the key question is not whether major assets are green; it is whether participation expands beyond the obvious leaders. Traders should treat improving breadth as permission to add beta, and deteriorating breadth as a signal to tighten hedges before the index admits there is a problem.