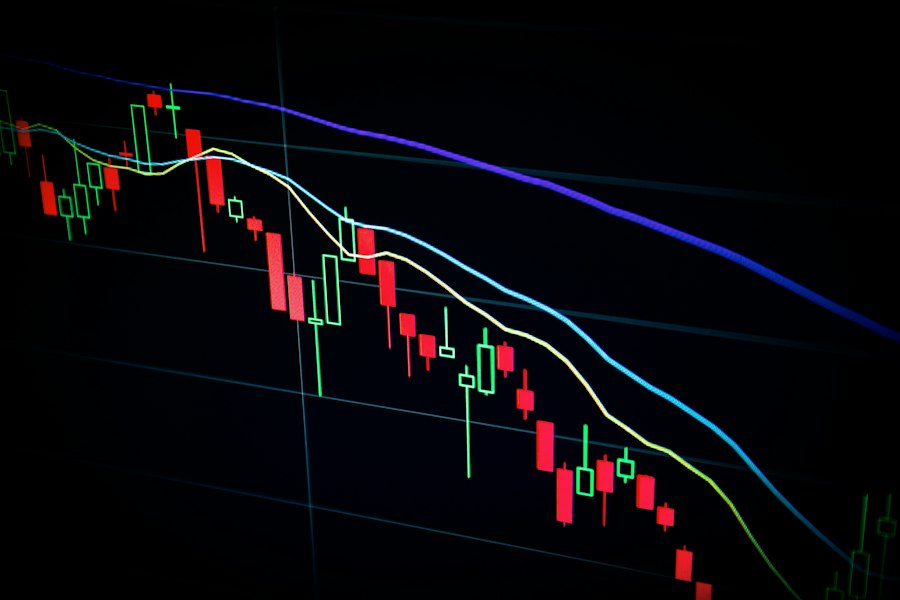
Market rallies do not fail because prices rise; they fail when fewer and fewer stocks, sectors, or tokens are doing the work. That distinction matters now because index-level performance can look healthy even as participation deteriorates beneath the surface, especially in cap-weighted benchmarks dominated by mega-cap technology and liquidity-sensitive crypto majors.
For traders, breadth is not a sentiment indicator. It is a market structure tool. It tells us whether incremental capital is being distributed across the risk curve or concentrated in a small set of names with superior liquidity, earnings momentum, buyback support, or options-driven flows. Broad rallies tend to absorb shocks. Narrow rallies can keep climbing, but they become increasingly dependent on perfect execution from the leaders and benign volatility conditions.
What is market breadth?
Market breadth measures how many securities are participating in a move, not just whether the headline index is rising. A rally is broad when gains are confirmed by advancing issues, new highs, sector rotation, and equal-weight performance; it is narrow when index gains depend on a small number of high-capitalization leaders.
The simplest breadth measure is the advance-decline line, which cumulates the number of rising securities minus falling securities. A healthier rally usually shows the index and the advance-decline line making highs together. A warning signal appears when the S&P 500 or Nasdaq 100 prints a new high while the advance-decline line stalls or rolls over.
I also track four higher-quality breadth gauges: the percentage of members above their 50-day moving average, the percentage above their 200-day moving average, the ratio of equal-weight to cap-weight index performance, and net 52-week highs versus lows. Each captures a different time horizon. The 50-day metric is tactical participation; the 200-day metric is regime quality; equal-weight relative strength shows whether the average stock is keeping pace; new highs/lows reveal whether leadership is expanding or decaying.
Useful thresholds are blunt but effective. When more than 60% of index members trade above their 50-day moving average, rallies usually have tactical confirmation. When that figure falls below 45% while the index remains near highs, the market is becoming dependent on fewer names. On a structural basis, bull markets are more resilient when more than 70% of members sit above their 200-day moving average. Below 50%, the index can still rise, but risk/reward becomes more asymmetric.
How does breadth analysis work in cap-weighted markets?
Cap-weighted indices can rise even when most constituents lag because the largest companies carry disproportionate influence. Breadth analysis adjusts for that distortion by comparing headline index performance with equal-weight indices, sector participation, and member-level trend data.
This is why narrow rallies are often misread. In a cap-weighted index, a 3% move in a $3 trillion company can offset weakness across dozens of smaller constituents. The S&P 500 top 10 stocks have recently represented roughly one-third of index market value, a level of concentration that makes headline performance less representative of the median stock. In the Nasdaq 100, concentration risk is even more pronounced because index exposure is clustered in semiconductors, software, platform companies, and a small number of AI-linked balance sheets.
The equal-weight versus cap-weight ratio is one of the cleanest diagnostics. If the S&P 500 rises while the S&P 500 Equal Weight Index underperforms, the rally is being carried by size and momentum rather than broad demand. This does not automatically mean the rally is bearish. In 2023, the so-called Magnificent Seven generated an estimated majority of S&P 500 gains, yet the index still produced a strong year because earnings revisions, AI capital expenditure, and liquidity preference favored mega-cap quality. Narrow leadership can be rational when profit growth is narrow.
The problem starts when narrow leadership combines with deteriorating internals. If the index is above its 50-day moving average but fewer than half its members are, systematic strategies see a mixed signal. Trend-followers remain long the index, while discretionary managers notice weakening participation. That creates unstable positioning: the index looks strong enough to chase, but the average constituent is not confirming the move.
My rule of thumb: a narrow rally is tolerable when leaders are making new highs on rising earnings revisions and falling credit stress. It becomes dangerous when leaders are making new highs while equal-weight indices, small caps, banks, and transports diverge lower.
Why does narrow leadership matter for traders?
Narrow leadership matters because it changes the volatility profile of a rally. When performance depends on a few crowded leaders, index volatility can stay suppressed until a small number of stocks break support, at which point correlation rises quickly.
This is where options market structure becomes central. Mega-cap leaders often have the deepest options markets, the largest dealer gamma exposure, and the most systematic call-buying activity. When these names trend higher, dealers may be short calls and forced to buy underlying shares as spot rises, reinforcing momentum. If implied volatility remains contained, the rally can appear unusually smooth. That smoothness is not the same as durability; it is often a function of dealer hedging and concentrated flow.
The risk is that positive gamma conditions can flip. If leaders fall through large open-interest strikes, dealer hedging can shift from stabilizing to destabilizing. Index-level put demand then rises, correlations move toward one, and a market that looked calm can reprice quickly. This is why narrow rallies often have low realized volatility before they break. The absence of volatility is not proof of broad participation.
For volatility traders, breadth deterioration is a reason to watch skew rather than simply buy VIX exposure. If the VIX is low but single-stock put skew in the leaders is cheap relative to index skew, hedging the crowded leadership can offer cleaner convexity. Conversely, when breadth is improving and volatility remains elevated, selling index downside or funding call spreads through put spreads can have attractive risk/reward because participation reduces gap risk.
There is also a liquidity angle. Broad rallies tend to pull capital into cyclicals, financials, industrials, small caps, and high-beta credit. Narrow rallies often hide defensive liquidity preference: investors buy what they can own at size. That is why a market led only by mega-cap technology can coexist with weak regional banks, lagging small caps, and soft commodity-sensitive equities. It is risk-on at the index level, but not necessarily risk-on across the economy.
Are crypto rallies broad-based or dangerously narrow?
Crypto breadth is broad when Bitcoin strength is confirmed by Ethereum, large-cap alts, DeFi tokens, exchange tokens, and rising on-chain risk appetite. It is narrow when BTC and one or two majors rise while the altcoin complex, liquidity pools, and perpetual funding data fail to confirm.
The supplied market snapshot shows BTC at $64,076, up 2.22% over 24 hours, and ETH at $1,787.52, up 3.02%. That is constructive at the top of the crypto stack, particularly because ETH is outperforming BTC on the day. But breadth is mixed: BNB is up only 0.74%, SOL is up 0.42%, and ADA is down 0.66%. A real broad-based crypto rally would usually show stronger beta transmission into SOL, mid-cap Layer 1s, DeFi governance tokens, and higher-volume altcoin perpetuals.
Crypto breadth should be measured differently from equity breadth because market caps are more fragmented and liquidity is thinner. I focus on four indicators: the share of top 100 tokens trading above their 30-day and 100-day moving averages, BTC dominance, ETH/BTC trend, and the distribution of funding rates across perpetual futures. If BTC rallies while BTC dominance rises sharply and funding is concentrated in BTC perps, the move is leadership-driven, not ecosystem-wide. If ETH/BTC rises and funding broadens without extreme leverage, participation is healthier.
Altcoin breadth is particularly important because crypto risk cycles usually move down the liquidity curve. Phase one is BTC absorption, often ETF or macro-liquidity driven. Phase two is ETH and high-quality majors. Phase three is broad altcoin beta, DeFi total value locked growth, and speculative rotation. If a rally stalls in phase one or two, it can still be profitable, but traders should size it like a liquidity rally rather than a full risk-cycle expansion.
In the current snapshot, the market is not giving a clean all-clear. BTC and ETH strength says marginal demand is present. The muted response in SOL and BNB, plus ADA weakness, says the bid has not yet broadened meaningfully. For a confirmation signal, I would want ETH/BTC to hold higher for several sessions, top-100 token participation above 60% on a 30-day trend basis, and funding rates positive but not euphoric across more than just BTC and ETH.
What signals confirm a healthy rally?
A healthy rally is confirmed when price, participation, and volatility align. The strongest signal is not an index breakout alone, but an index breakout accompanied by expanding new highs, improving equal-weight relative strength, and stable or falling credit and volatility stress.
In equities, I want to see cyclical confirmation. Banks matter because they transmit credit risk. Industrials and transports matter because they confirm real-economy demand. Small caps matter because they are more sensitive to financing conditions. If large-cap technology leads while banks, transports, and small caps fail to participate, the rally may be more about duration, liquidity, and buybacks than broad economic confidence.
Sector breadth also matters more than raw constituent breadth during late-cycle markets. A rally led by technology, communication services, and consumer discretionary can be powerful, but if defensive sectors such as utilities and staples are the only other participants, the message is mixed. The cleanest bull-market confirmation comes when leadership rotates without breaking the prior leaders. That is different from a violent rotation where leaders sell off and laggards bounce; the latter is often de-risking disguised as breadth improvement.
Options flow can confirm or reject breadth. A broad rally with balanced call buying across sectors is healthier than a rally where call premium is concentrated in two AI-linked stocks. I track single-name call volumes relative to 20-day averages, index put-call ratios, and dealer gamma zones. When call demand broadens but implied volatility does not explode, it suggests participation without excessive leverage. When call demand is extremely concentrated and short-dated, the rally becomes more vulnerable to a gamma air pocket.
For portfolio construction, the practical approach is to score breadth rather than debate it. I use a five-part checklist: percentage above 50-day moving average, percentage above 200-day moving average, equal-weight relative trend, net new highs, and sector participation. Four or five positives justify adding beta. Two or three positives justify selective exposure. One or fewer means keep gross exposure tight and express upside through call spreads rather than outright high-beta longs.
What happens if breadth keeps deteriorating?
If breadth keeps deteriorating while headline indices rise, the rally becomes more fragile and more sensitive to shocks in the largest leaders. The likely outcome is either rotation that repairs participation or a volatility event that forces the index to catch down to weaker internals.
The benign scenario is rotation. Mega-cap leaders consolidate rather than collapse, capital moves into lagging sectors, and the equal-weight index starts outperforming. In that setup, implied volatility can remain contained and pullbacks are buyable because selling pressure is absorbed by newly improving groups. This is the ideal path for bulls: breadth improves through sideways action in the leaders, not through a sharp unwind.
The bearish scenario is leadership failure. If the handful of stocks or tokens carrying the market lose momentum simultaneously, there is not enough participation underneath to cushion the index. Correlations rise, systematic strategies reduce exposure, and volatility sellers retreat. In equities, that often shows up as a fast move higher in index skew and a breakdown in the equal-weight ratio. In crypto, it shows up as BTC failing to hold support while altcoins underperform on higher liquidation volumes.
Traders should not treat narrow breadth as a timing signal by itself. Narrow rallies can persist for months when liquidity is abundant and earnings leadership is real. The better use is position sizing. When breadth is strong, own more spot beta and sell volatility selectively. When breadth is narrow, reduce leverage, avoid chasing extended leaders, and use defined-risk structures such as call spreads, put spreads, or collars. The goal is not to predict the exact turn; it is to avoid paying peak multiples for a rally with declining participation.
Key Takeaway
Market breadth answers the question headline indices cannot: whether a rally is supported by broad demand or concentrated in a few crowded leaders. The current framework says broad participation remains the key confirmation signal across both equities and crypto, especially when cap-weighted performance can mask weak internals.
A narrow rally is not automatically bearish, but it is lower quality and more volatility-sensitive. Until equal-weight performance, sector participation, and crypto altcoin breadth improve, traders should respect the upside trend while managing exposure as if the margin for error is shrinking.