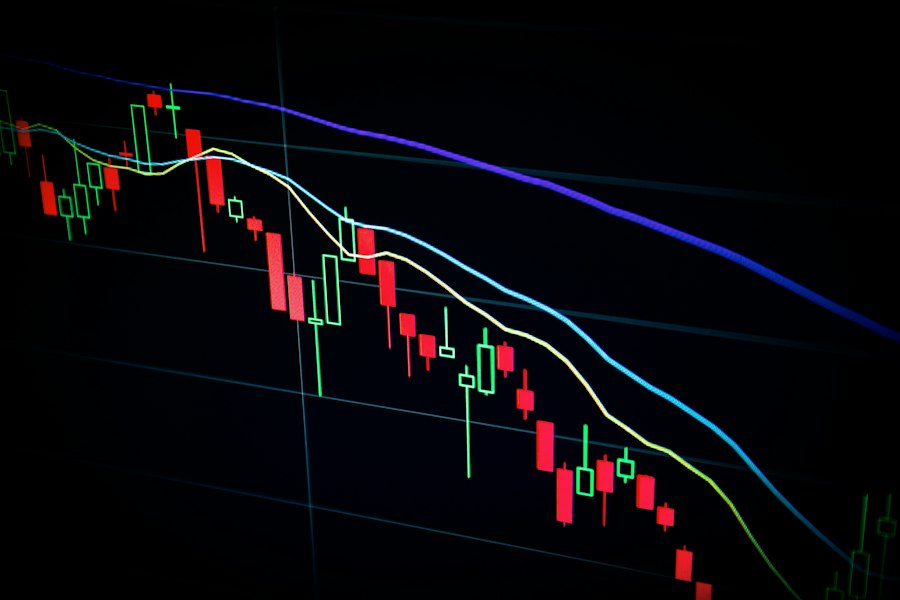
Bitcoin halvings are often sold as a simple scarcity story: supply falls, price rises, and a parabolic bull market follows. The historical record is more nuanced. The halving has reliably tightened new issuance, but the size, timing, and volatility of each cycle have depended on liquidity conditions, long-term holder behavior, miner balance sheets, and speculative leverage. With BTC trading near $64,777 after the 2024 subsidy cut, the relevant question is not whether the halving is bullish in isolation. It is whether reduced miner supply is meeting a market structure capable of absorbing drawdowns without forcing a broad deleveraging.
The Halving Is a Supply Shock, but Not an Instant Price Trigger
Bitcoin’s fourth halving reduced the block subsidy from 6.25 BTC to 3.125 BTC, cutting gross new issuance from roughly 900 BTC per day to 450 BTC per day. At a spot price of $64,777, that is a reduction of about $29 million in daily sell-side issuance, or approximately $10.6 billion annualized. In macro terms, that is not large relative to global liquidity, but in Bitcoin’s microstructure it matters because miners have historically been consistent marginal sellers.
The key analytical mistake is treating the halving date as a timer. In previous cycles, the strongest gains came months after the event, once reduced issuance interacted with rising demand and declining liquid supply. The halving changes the flow; it does not automatically change the bid. That distinction is why post-halving consolidation has been normal, not a failure of the thesis.
The 2024 cycle is especially different because Bitcoin made a new all-time high before the halving for the first time in its history, driven by U.S. spot ETF demand from issuers including BlackRock, Fidelity, Ark Invest, and Bitwise. That front-loaded demand shifted part of the usual post-halving repricing into the pre-halving window. Investors expecting a repeat of 2013 or 2017 without accounting for ETFs, higher market capitalization, and institutional hedging are using the wrong cycle template.
What Prior Cycles Actually Show
The historical pattern is clear but decelerating. After the 2012 halving, Bitcoin rose from roughly $12 to about $1,150 within a year, a gain of more than 90x in a market with minimal institutional participation and thin liquidity. After the 2016 halving, BTC moved from around $650 to nearly $19,600 in December 2017, roughly 30x. After the 2020 halving, Bitcoin advanced from about $8,600 to $69,000 in November 2021, an 8x move supported by zero-rate policy, fiscal stimulus, corporate treasury buying, and explosive retail activity.
The direction has been consistent; the magnitude has compressed. That is exactly what should happen as an asset moves from an experimental network to a trillion-dollar macro instrument. Each halving reduces the new supply rate, but each cycle also requires more nominal capital to generate the same percentage return. A 10x move from a $100 billion network is very different from a 10x move from a $1.3 trillion network.
Timing has also stretched. The 2013 cycle peak came about 12 months after the halving. The 2017 peak arrived roughly 17 months later. The 2021 top occurred about 18 months after the 2020 halving. If that rhythm remains relevant, the highest-probability window for a post-2024 cycle peak would fall between the second half of 2025 and early 2026. But that window should be treated as a risk-management framework, not a forecast carved into stone.
- 2012 cycle: low institutional ownership, extreme reflexivity, and thin exchange liquidity produced the largest percentage gains.
- 2016 cycle: exchange infrastructure improved, ICO speculation amplified risk appetite, and Bitcoin led before capital rotated into altcoins.
- 2020 cycle: monetary stimulus, Grayscale demand, corporate buyers, and derivatives expansion accelerated the move.
- 2024 cycle: spot ETFs, professional basis trading, and deeper options markets have made the cycle more institutional but also more crowded.
On-Chain Signals: Supply Is Tight, but Profit-Taking Is Rational
On-chain data supports the idea that the market is structurally tighter than in prior mid-cycle periods. Exchange balances have trended lower for years, falling from above 3 million BTC during the 2020 cycle to the low-to-mid 2 million BTC range across major exchange wallets tracked by Glassnode and CryptoQuant. The exact count varies by provider methodology, but the direction is consistent: fewer coins are sitting on venues where they can be sold immediately.
Long-term holder supply has also become a central variable. Historically, coins held for at least 155 days begin moving more aggressively as price approaches prior highs and unrealized profit expands. That is not automatically bearish. In every bull market, long-term holders distribute into strength while new buyers absorb supply. The cycle only becomes fragile when long-term holder selling overwhelms spot demand and derivatives positioning becomes too leveraged.
Realized cap is the better metric than market cap for judging the cycle’s health. Market cap marks every coin at the latest price; realized cap values coins at the price where they last moved. In previous late-cycle phases, realized cap accelerated sharply as old coins were distributed to new buyers at much higher prices. If realized cap is rising while exchange balances remain low, it indicates capital is entering the network rather than merely rotating through leveraged futures.
MVRV, NUPL, and spent output profit ratio should be watched together. Prior blow-off tops have typically featured elevated MVRV readings, euphoric unrealized profit, and sustained high SOPR as investors repeatedly sold coins at large gains. A healthier post-halving advance would show profit-taking in waves, not a vertical acceleration in all profit metrics simultaneously. That distinction matters because Bitcoin can trend higher for months while still digesting distribution from early-cycle holders.
Miner Economics Are the First Stress Test
Miners are the most direct victims of the halving. Revenue per block was cut in half before transaction fees, while electricity, hosting, debt service, and machine costs did not fall by 50 percent. Public miners such as Marathon Digital, CleanSpark, Riot Platforms, and Core Scientific entered the 2024 halving with very different cost structures, balance sheets, and fleet efficiency. The market is already separating operators with low power costs and next-generation ASICs from those dependent on high Bitcoin prices to survive.
The most important miner metric is not hash rate alone but hashprice, the dollar revenue earned per unit of computing power. When the subsidy falls, miners either need a higher BTC price, higher transaction fees, lower difficulty, or cheaper energy. The 2024 halving briefly exposed the importance of fee markets, with new activity around Bitcoin-based assets pushing transaction fees higher around the event. But investors should not assume fee spikes are permanent. A sustainable bull case requires either durable fee demand or continued BTC appreciation.
Miner capitulation has historically created attractive intermediate-term opportunities, but only after inefficient operators have sold inventory or shut down machines. Watch miner wallet outflows, difficulty adjustments, and public miner treasury disclosures. A rise in miner-to-exchange transfers during weak price action would signal forced selling pressure. Conversely, stable miner reserves alongside rising difficulty would indicate the network is absorbing the subsidy shock without systemic stress.
ETFs and Derivatives Have Rewired the Cycle
The largest structural change in this halving cycle is the introduction of U.S. spot Bitcoin ETFs. In the first quarter after approval, net ETF demand at times exceeded daily new issuance by several multiples, especially during strong inflow periods into BlackRock’s IBIT and Fidelity’s FBTC. That created a simple but powerful imbalance: regulated spot demand was buying more Bitcoin than miners were producing.
However, ETF flows are not a one-way machine. They are procyclical. In risk-on periods, ETFs compress the float and accelerate upside. In risk-off periods, outflows or slower inflows remove the marginal bid that traders have come to rely on. This makes weekly ETF flow data one of the most important indicators for the post-halving market. A $500 million daily inflow environment is very different from a flat or negative flow environment when miners are still selling and leveraged longs are crowded.
Derivatives add a second layer. CME futures open interest now represents a much larger share of Bitcoin exposure than in earlier cycles, reflecting institutional basis trades and hedged ETF-related strategies. That is healthier than purely offshore leverage, but it also means spot price can be influenced by funding rates, futures basis, and options dealer positioning. When perpetual funding stays elevated for too long, the market becomes vulnerable to liquidation cascades even if spot ETF demand remains constructive.
Options markets also matter more than they did in 2020. Large open interest around round-number strikes such as $70,000, $80,000, and $100,000 can shape short-term price action through dealer hedging. A clean break above major call walls can force hedging flows that amplify upside, while repeated failures near those levels can encourage volatility selling and range-bound trading. This is why the next Bitcoin bull phase may look less like a straight line and more like a sequence of volatility squeezes around institutional positioning.
What to Expect Next
The base case is that the halving remains bullish over a 12-to-18-month horizon, but with lower percentage returns and more institutionalized volatility than prior cycles. Reduced issuance, lower exchange balances, and ETF access create a favorable supply-demand backdrop. Against that, higher real rates, a larger market cap, and more sophisticated hedging limit the probability of a 2017-style vertical melt-up.
The strongest confirmation would come from three signals appearing together: sustained spot ETF inflows, rising realized cap, and neutral-to-moderate funding rates. That combination would indicate real capital entering the market without excessive leverage. The weakest setup would be the opposite: flat ETF flows, rising exchange deposits from long-term holders or miners, and highly positive funding. That would suggest price is being supported by leverage rather than durable demand.
For portfolio strategy, the halving argues for patience rather than blind leverage. Historically, Bitcoin has rewarded investors who accumulated before and shortly after halvings, but it has punished those who chased crowded breakouts after funding spiked. In this cycle, the better edge is monitoring the balance between ETF demand and available liquid supply. If daily net ETF buying consistently exceeds newly mined supply while long-term holder distribution remains orderly, Bitcoin can grind higher even without retail mania.
The halving is not magic. It is a recurring liquidity test. The market that passes that test is the one where reduced issuance meets persistent spot demand, disciplined leverage, and miners strong enough to avoid forced selling.
Bitcoin’s next phase will likely be defined by that test. The old four-year cycle still provides a useful map, but the terrain has changed. Spot ETFs have institutionalized demand, derivatives have deepened liquidity, and on-chain supply remains historically tight. The investors who outperform will not be the ones who memorize past cycle returns. They will be the ones who track flows, miner stress, and leverage in real time as the post-halving supply shock works its way through a much more mature Bitcoin market.